Visualization
Sample description for Visualization

Displaying Live Date & Time in PI Vision: A Step-by-Step Tutorial
Learn how to display the current date and time in PI Vision dashboards using PI Asset Framework attributes and powerful time substitution parameters. This tutorial guides you through each step.
Samuel Mensah

Troubleshooting PI Vision Custom Symbols: Audible Alerts Not Playing
Is your PI Vision custom symbol's audible alert staying silent? Learn to troubleshoot common issues like browser autoplay policies, JavaScript errors, and file path problems.
Megan Tremblay

PI Vision Daily Averages: Trending Aggregated Data Directly
Learn how to display daily averages in AVEVA PI Vision trends and tables directly using built-in calculations, without creating new PI tags or AF formulas. We also cover AF Analytics as a best practice.
Isabel Fernandez

PI Vision vs. PI ProcessBook: Choosing Your Factory Control Interface
Compare PI Vision and PI ProcessBook for factory production control interfaces. Understand their architectures, development methods, and which is better suited for modern industrial visualization needs.
Pieter van den Berg
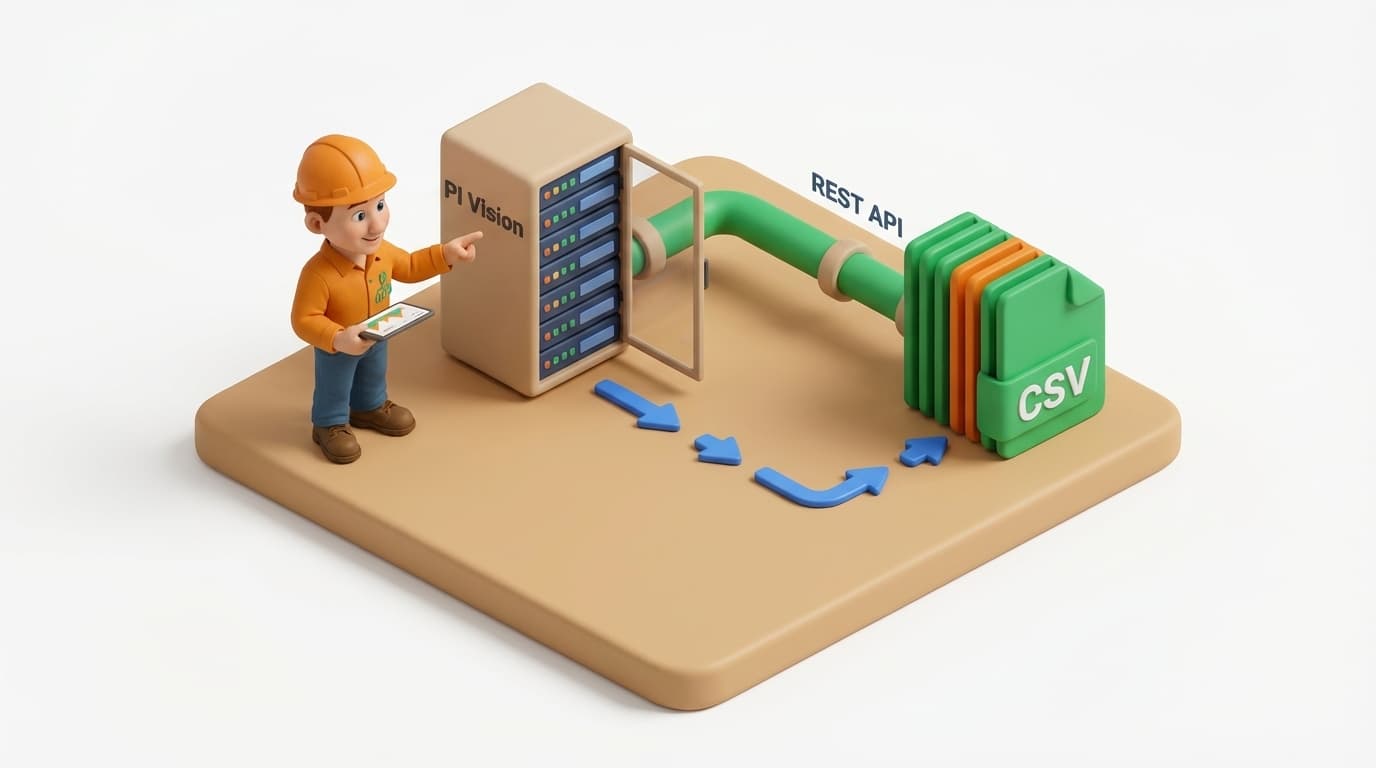
Exporting PI Vision Data to Excel/CSV: A Comprehensive Guide
Learn how to export PI Vision tabular data to Excel/CSV using built-in features, PI Web API, AF SDK, or PI DataLink for comprehensive data analysis and reporting.
Oliver Hughes

PI Point Span & Zero: Unpacking Their True Impact on Data Storage and Display
Demystify the PI Point Span and Zero attributes. Learn their critical, often misunderstood, roles in data archiving for Float16 points, compression calculations, and client visualization in the PI System.
Samuel Mensah

Power BI & PI System: Integrating Operational Data for Business Insight
Unlock operational intelligence by integrating AVEVA PI System data with Microsoft Power BI. This deep dive explores various methods, from PI Integrator for Business Analytics to PI OLEDB Enterprise, for robust reporting and analytics.
Nadia Kowalczyk

Exporting PI System Data to Excel: A PI DataLink Tutorial
Learn how to export PI System data to Excel using PI DataLink. This step-by-step tutorial covers retrieving historical and current values for your school project or analysis.
Thomas Müller

Enhancing PI Trends: Banding and Limit Zones in PI Vision and ProcessBook
Visualizing operational limits on PI trends is crucial. This article explores the demand for trend banding and limit zones, PI ProcessBook's limitations and VBA workarounds, and how AVEVA PI Vision natively addresses these visualization needs.
Andres Vargas
Dynamically Customize AFElement Icons in AFTreeView with AF SDK
Enhance your PI System UI by dynamically changing AFElement icons in AFTreeView using custom images and the AF SDK. Learn how to preserve default icons and ensure consistent display with 20x16 pixel graphics.
Wei Zhang

Adding PI Points to XY-Plots in PI ProcessBook from .NET
Learn how to dynamically add PI Points or AF Attributes to an existing XY-Plot in PI ProcessBook using .NET code, leveraging the underlying COM libraries like XYPlotLib.dll for seamless integration.
Lucas Dubois

PI ProcessBook Playback: Custom Dynamic Trace Redrawing
Explore creating custom animated playback in PI ProcessBook for dynamic trace redrawing. Learn about VBA, PI Calculation Datasets, limitations, and modern alternatives like PI Vision.
Jack Morrison
About Visualization
Explore our collection of expert articles about Visualization. Our content is written by experienced PI System professionals and covers everything from basic concepts to advanced implementation techniques.
Whether you're new to PI System or an experienced engineer, you'll find valuable insights, tutorials, and best practices to help you get the most out of your industrial data infrastructure.